Data visualization
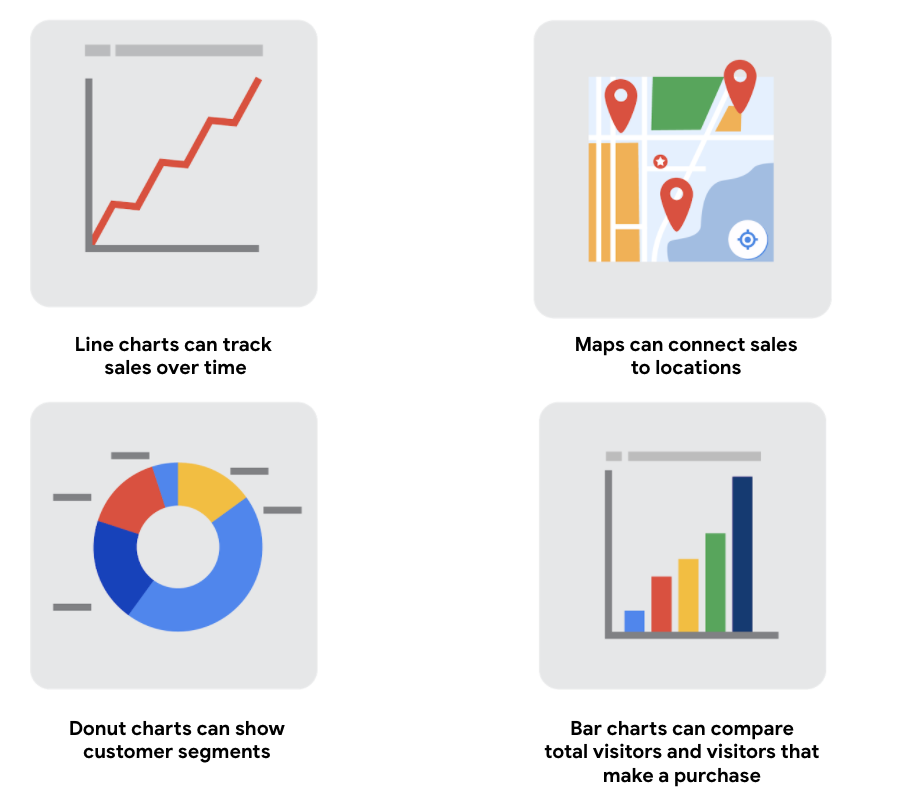
Data visualizations are pictures, they are a wonderful way to take very basic ideas around data and data points and make them come alive.
Data visualization allows you:
-
explain complex data quickly
-
explore data
-
create interesting graphs
Steps to plan a data visualization
-
Explore the data for patterns
-
Plan your visuals
-
Create your visuals

Build your data visualization toolkit
-
You can use the visualizations tools in your spreadsheet to create simple visualizations such as line and bar charts.
-
You can use more advanced tools such as Tableau that allow you to integrate data into dashboard-style visualizations.
-
If you’re working with the programming language R you can use the visualization tools in RStudio.
-